scmv
scmv visualizes the actual information regarding earthquakes, trigger status, ground motion and station quality. This information is visualized in a map showing also the topography of the region including bathymetry, state borders and geologic faults. scmv provides three different tabs with maps showing different information: the ground motion, events and network status tab. A detailed list of functions and hotkeys is listed below.
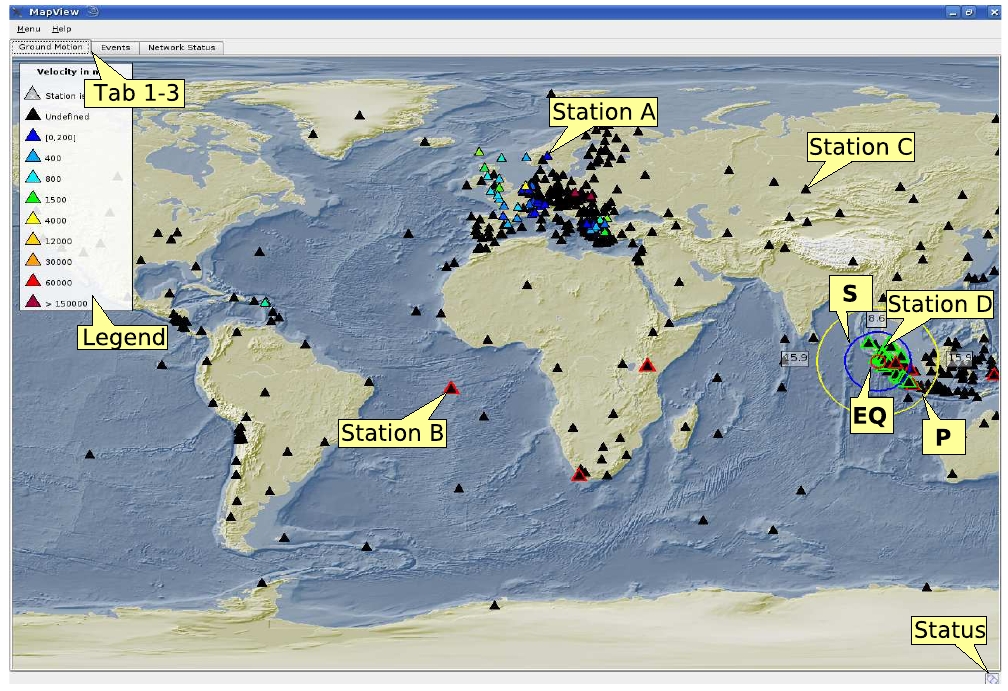
The ”ground motion” tab (Fig. 5-4) shows the actual groundmotion in nm/s at each station color-coded.
Furthermore the trigger status (new picks) of the stations are announced by blinking triangles (the same in all other tabs). In case a new pick is associated to an event, the blinking color changes from red to green (default). Events are represented by open circles and the depth is color-coded. By right mouse click on the symbol of a station or event more detailed information are shown in an information widget (Fig. 5-7).

Figure 5-4: Ground motion tab of scmv. Tab 1-3 = Ground Motion, Events, Network Status tab; Station A = station with ground motion between 0 and 200 nm/s; Station B = triggering (red blinking) station; Station C = station of undefined status; Station D = triggering and associated station (green blinking); EQ = location of the earthquake/event; P = spreading of the P-wave; S = spreading of the S-wave; Legend = ground motion scale; Status = connection status.
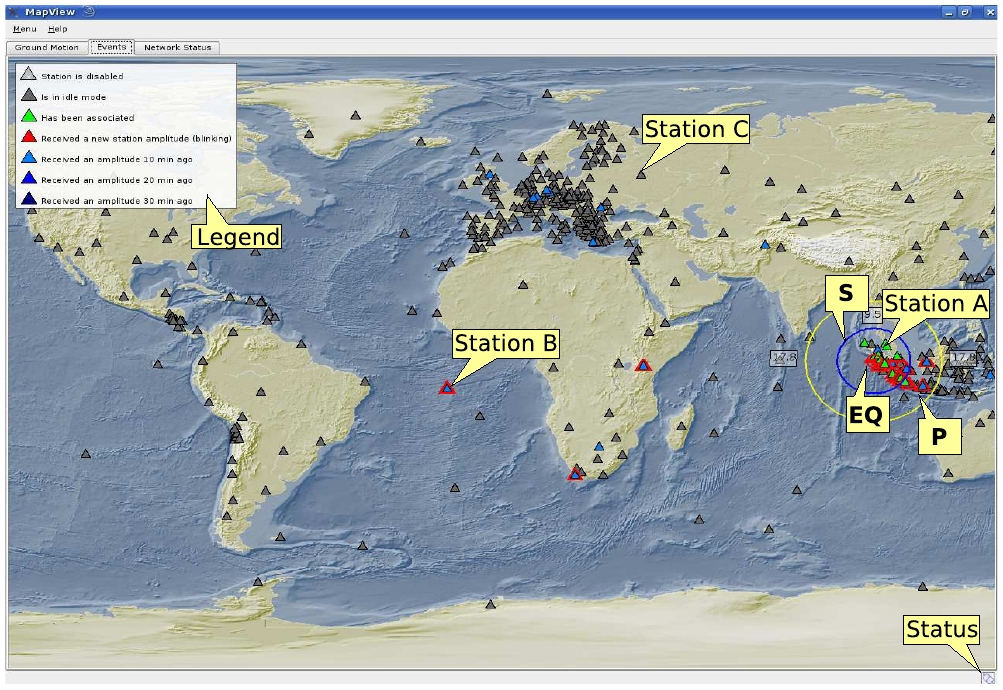
The ”events” tab (Fig. 5-5) shows by default the last earthquake and the associated stations
(green triangle like Station A). In addition an event list can be toggled in to see further events with their associated stations. This tab enables the operator to recognize systematic problems in the system which influence the picking and locating process.

Figure 5-5: Event tab of scmv. Station A = triggering and associated station to last event (green blinking); Station B = triggering station (red blinking) with amplitude ; Station C = station is in idle mode; EQ = location of the earthquake/event; P = spreading of the P-wave; S = spreading of the S-wave; Legend = scale of the station status; Status = connection status.
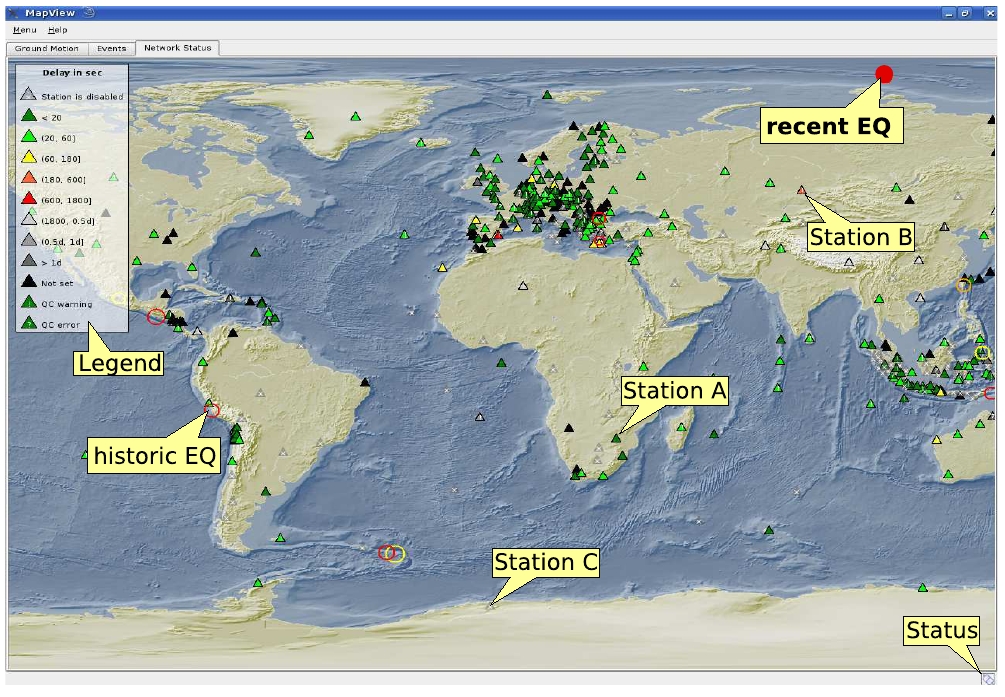
The ”network status” tab (Fig. 5-6) visualizes the timing quality of the whole seismic network. The colors of the triangles represent the data latencies/delay of the station. More detailed information about station quality can be derived by opening an information widget (Fig. 5-7 left) with a right mouse click on the symbol.

Figure 5-6: Network status tab of scmv. Station A = station with up to 20 sec data latency/delay; Station B = station with up to 10 min data latency/delay and a warning; Station C = disabled station; EQ = location of a recent or historic earthquake/event; Legend = scale of the delay; Status = connection status.
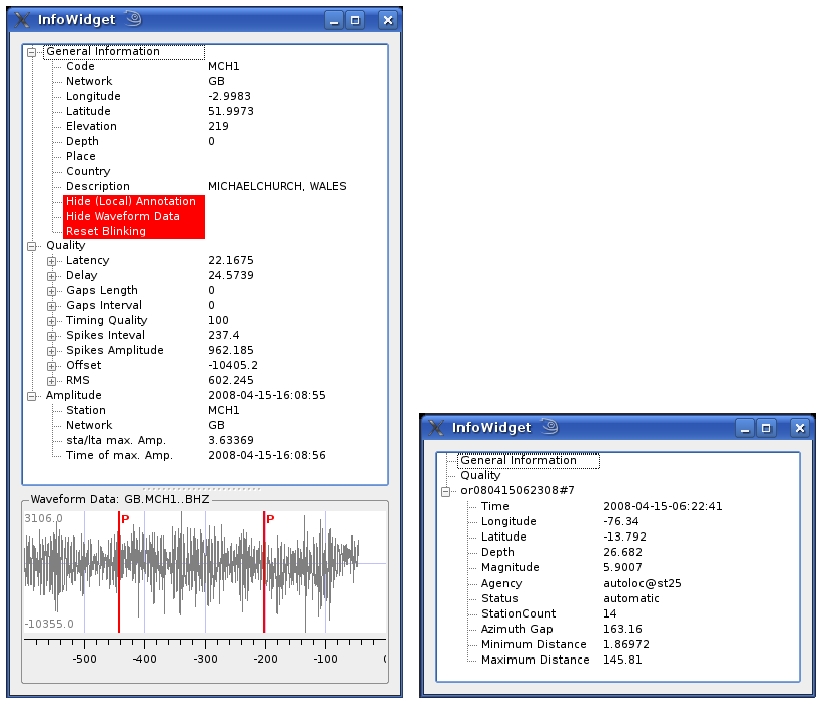
The “information widget” opens by right mouse click on a station or event symbol in one of the scmv maps. The widget gives a more detailed list of parameters. For a station general information (coordinates, network code etc.), quality parameter (latency, gaps etc.), amplitude information and the actual waveform data are provided. For an event information like the location, the number of stations and the azimuthal gap are shown.

Figure 5-7: Infowidget of a station (left) and an event (right). Left: (station information widget) Besides the general information like network code and position the quality of the station can be checked here. Even the actual waveform data with picks (red) are displayed. Right: (event information widget) A summary of the event parameters like origin time, position, magnitude, number of contributing stations etc. is shown.
Options
scmv supports commandline options as well as configuration files (scmv.cfg).
Commandline
Only the default application class options are available (see chapter 5.2.2 for details).
Configuration
Users configuration file: $HOME/.seiscomp3/scmv.cfg
- infowidget.filter <filter string> [BW(4,0.7,2)]
- Filter for the trace in the infowidget
- stations.filter <filter string> [BW(4,0.7,2)]
- Filter used for groundmotion determination
- stations.minblinkduration <int> [5]
- Minimum duration of blinking in seconds.
- stations.maxblinkduration <int> [240]
- Maximum duration of blinking in seconds.
- readEventsNotOlderThan <double>
- Maximum age of loaded events in seconds (default is 0.0001)
- removeEventDataOlderThan <double>
- Events are removed if older than this value (time in seconds)
- showHistoricOrigins <bool>
- Show historic origins
- centerorigins <bool>
- Center mapview to latest origin
Example of scmv.cfg:
connection.username = scmv2x1
commands.target = .∗x1$
infowidget.filter = BW(4,0.7,2)
stations.filter = BW(4,0.7,2)
stations.minblinkduration = 5
stations.maxblinkduration = 240
readEventsNotOlderThan = 259200.0
removeEventDataOlderThan = 259200.0
centerorigins = true
showHistoricOrigins = true
Hotkeys and mouse interactions
| Hotkey | Description |
| F2 | Setup connection dialog |
| F3 | Show ray paths and associated stations |
| F6 | Hide propagation of P and S waves |
| F7 | Hide legend |
| F8 | Show historic origins |
| F9 | Show station annotation |
| F10 | Show event list (event tab) |
| F11 | Toggle full screen mode |
| Arrows | Move focus |
| Mouse wheel | Zoom in or out |
| Double click | Center map |
| Right mouse button | Open info widget |
| Mid mouse button | Set preliminary origin |
Uses cases
- Get station information
-
- Position the mouse above a triangle representing the location of a station
- Click the right mouse button for opening the infowidget.
- Choose one station in case several stations are in the selection range
- Get event information
-
- Position the mouse above a circle representing a location of an event
- Click the right mouse button for opening the infowidget.
- Choose one event in case several stations are in the selection range
- Set preliminary origin
-
- Position the mouse in the map
- Press the mid mouse button
- Set date & time and latitude & longitude
- Press ”add origin”
- Control waveform data quality
-
- Follow use case ”get station information”
- Click on ”show waveform” in the infowidget
- Reset blinking
-
- Follow use case ”Control waveform data”
- Click on ”Reset blinking” in the infowidget
- Search station/network
-
- Press ”CTRL” + ”F”
- Type station/network name
Attachments
-
Network_status_tab_of_scmv.jpg
 (0.5 MB) - added by jabe
Network status tab of scmv
-
Ground_motion_tab_of_scmv.jpg
(0.5 MB) - added by jabe
-
Infowidget_of_a_station.jpg
(166.6 KB) - added by jabe
-
Event_tab_of_scmv.jpg
(0.5 MB) - added by jabe